CHAPTER III.EAFM Indicator Assessment Techniques in Stakeholder Domains
1. Data collection technique
Data collection techniques are carried out to collect data and information according to each domain and indicator. Each of these indicators has criteria to determine its status. Assessors need to know where and how the data sources can be obtained because each indicator has a different primary and secondary data source.
The stakeholder identification process is carried out in a planned but flexible manner by considering the resources and time available. The process includes the following:
-
Indeep Process:
-
Define key figures;
-
key information;
-
group identification;
-
map stakeholders;
-
needs analysis.
-
Reviews Process:
-
Region identification;
-
evaluation of secondary demographic data;
-
do verification;
-
do the mapping process.
Interviews were conducted after determining the selected respondents from the sampling results. It used face-to-face debriefing using a guide or questionnaire to obtain information according to the purpose of this study. The characteristics of direct interviews are as follows:
-
The interviewer and Respondent Don't Know Each Other;
-
Interviewer Asks, Respondent Answers;
-
The Interviewer is Neutral, Not Directing Respondents; And
-
Questions Asked Following Guidelines Or Questionnaires.
Sampling was done using stratified random sampling, where the interview respondents are determined in stages. This sampling technique pays attention to each population element from each group that does not overlap (homogeneous elements) and has the same opportunity to be taken. Strata sampling can use administrative. limits or the type of fishing gear used. The allocation of the sample number from each level is sought using the principle of proportional allocation. In carrying out the identification process, stakeholders need to pay attention to and have information about community sociology, anthropology, and the local culture of the people in each WPP area. This information can be obtained from online reviews or printed documents from reports and verified scientific writings. Data collection techniques for each indicator are described as follows:
-
A synergy of Cross-Sectoral Policies/Programs/Activities Indicator data/information synergyCross-sectoral policies/ programs/activities are obtained through:
-
Through direct coordination with all stakeholders to find out about programs/activities for the use/utilization of water resources, both through meetings and correspondence; and/or
-
Results of interviews with fishermen/other competent respondents.
The steps for assigning a criterion score to indicators of the synergy level of fisheries management policies are:
-
Collecting data on all indicators of the level of synergy of fisheries management policies in an inland waters ecosystem;
-
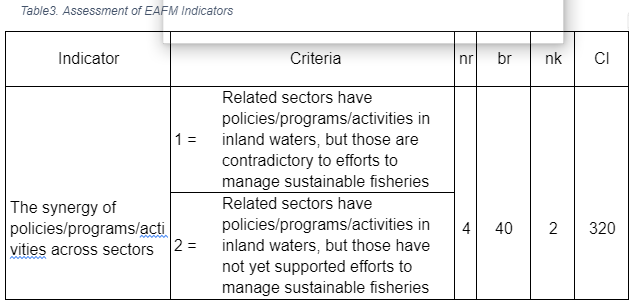
Give the criterion value (nk), the indicator of the level of synergy of fisheries management policies, with the following value criteria:
-
nk 1 = related sectors have policies/programs/activities in inland waters but contradict efforts to manage sustainable fisheries.
-
nk 2 = related sectors have policies/programs/activities in inland waters. However, they have not yet supported efforts to manage sustainable fisheries
-
nk 3 = related sectors have policies/programs/activities in inland waters and support sustainable fisheries management efforts.
-
Some of the stakeholders who can be used as respondents in assessing stakeholder capacity indicators include:
-
Work Units in the Fields of Fisheries, Agriculture, Tourism, Environment and Forestry, Water Resources, ESDM, and Spatial Planning;
-
Fisheries Extension;
-
Fisherman.
2. Stakeholder Capacity
Stakeholder capacity indicator data/information can be obtained through:
-
The results of direct observations in the field to record the efforts that stakeholders have made to improve their roles, duties, and functions in sustainable fisheries management and measure their impact
-
Results of interviews with fishermen/other competent respondents
The steps for assigning a criterion score to the stakeholder capacity indicator are as follows:
-
Collecting data on all indicators of stakeholder capacity in an inland waters ecosystem;
-
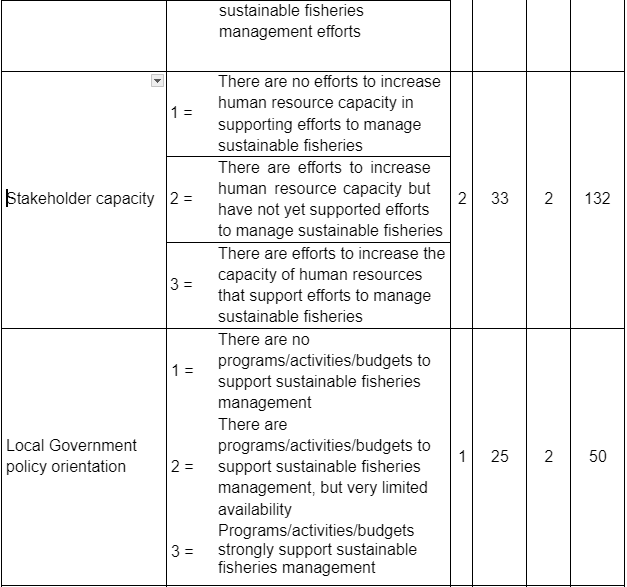
Rate the criteria (nk) of stakeholder capacity indicators with the following value criteria:
-
nk 1 =there is no effort to increase human resource capacity in supporting efforts to manage sustainable fisheries.
-
nk 2 = there are efforts to increase human resource capacity but have not yet supported efforts to manage sustainable fisheries.
-
nk 3 =there are efforts to increase the capacity of human resources that support efforts to manage sustainable fisheries.
Some of the stakeholders who can be used as respondents in assessing stakeholder capacity indicators include:
3. Local Government Policy Orientation
Data/information on indicators of policy orientation for the Regional Government can be obtained through the following:
-
Through direct coordination with relevant stakeholders to find out the priority orientation of sustainable fisheries management policies; and/or
-
Results of interviews with fishermen/other competent respondents
The steps for assigning a criterion score to the indicator of the orientation of the Regional Government's policy towards fisheries management are:
-
Collecting the data on all indicators of policy orientation of the Regional Government toward fisheries management in an inland waters ecosystem;
-
Give the value of the criteria (nk) indicators of the orientation of the Regional Government policies toward fisheries management with the following value criteria:
-
nk 1 = There are no programs/activities/budgets to support sustainable fisheries management.
-
nk 2 = There are programs/activities/budgets to support sustainable fisheries management, but they are very limited.
-
nk 3 = The availability of programs/activities/budgets strongly supports sustainable fisheries management
Several stakeholders who can be used as respondents in assessing indicators of policy support for fisheries management include:
-
Work units in the fisheries sector;
-
Work unit in the field of planning.
4. Local-scale fisheries management institutions
Institutional data/information on local scale fisheries management can be obtained through:
-
Through direct coordination with relevant local scale fisheries management institutions to find out local scale fisheries management institutions in sustainable fisheries management; and/or
-
Results of interviews with fishermen/other competent respondents
The steps for assigning a criterion score to institutional indicators for local-scale fisheries management are:
-
Collecting data on all institutional indicators of local scale fisheries management on fisheries management in an inland waters ecosystem;
-
Give the criterion value (nk) of local scale fisheries management institutional indicators for fisheries management, with the following value criteria:
-
nk 1 = there is no fisheries management institution
-
nk 2 = there are local fisheries management institutions, but they have not been effective
-
nk 3 =there are local fisheries management institutions that are already running effectively
-
Several local-scale fisheries management institutions that can be used as respondents in assessing indicators of policy support for fisheries management include:
3.2 Analysis Techniques
EAFM analysis is a multi-attribute approach to symptoms or performance indications of aquatic ecosystem conditions. Substantially, the assessment of EAFM indicators is a multi-criteria analysis system that assesses a composite index to determine the status of fisheries management using the Flag Modeling technique (Adrianto, Matsuda, and Sakuma, 2005). Data analysis is needed to find out the relationship between the current management performance status based on the data of each indicator in the stakeholder domain and recommendations for fisheries management actions that will be developed.
Currently, there are tools available that can be used to analyze the condition of EAFM in general and the conditions of each EAFM domain, especially the stakeholder domain, namely by using the EAFM indicator assessment matrix (as attached). In detail, the method for calculating the composite score on the indicators and stakeholder domains is described as follows:
-
A synergy of policies/programs/activities across sectors
The formula used to calculate the composite indicator (CI) value of cross-sector policy/program/activity synergy is:
𝐶𝐼7.1 = 𝑏𝑟7.1 × 𝑛𝑟7.1 × 𝑛𝑘7.1
Description:
CI7.1 = Composite indicators of synergy level of fisheries management policies br7.1 = the weight value indicator of the synergy level of fisheries management policies
nr7.1 = ranking value indicator of the synergy level of fisheries management policy
nk7.1 = criteria value indicator of the synergy level of fisheries management policies
From the 4 (four) indicators in the stakeholder domain, the ranking score for the synergy indicator of cross-sectoral policies/programs/activities is the highest among the existing indicators, with a value of 4. Thus the weight of the indicator for the level of synergy of fisheries management policies has a value of 57.1. It shows that the synergy indicators of cross-sectoral policies/programs/activities have the greatest influence on the stakeholder domain. Meanwhile, the formula used to calculate the weight value (br) of the synergy level of fisheries management policies is:
𝑏𝑟7.1 = (100 / (𝑛𝑟7.1 + 𝑛𝑟7.2 + 𝑛𝑟7.3)) 𝑥 𝑛𝑟7.1
2. Stakeholder capacity
The formula used to calculate the composite indicator (CI) value of stakeholder capacity is:
Description:
𝐶𝐼7.2 = 𝑏𝑟7.2 × 𝑛𝑟7.2 × 𝑛𝑘7.2
CI7.2 = composite stakeholder capacity indicator.`
br7.2 = weight value of stakeholder capacity indicator
nr7.2 = ranking value of stakeholder capacity indicator
nk7.2 = value of stakeholder capacity indicator criteria
From the 4 (four) indicators in the stakeholder domain, the ranking value of the stakeholder capacity indicator is the second lowest among the existing indicators, namely with a value of 2. Thus the weight of the stakeholder capacity indicator has a value of 28.6. It shows that the stakeholder capacity indicator has the least influence on the stakeholder domain. Meanwhile, the formula used to calculate the weight value (br) of the stakeholder capacity indicator is:
𝑏𝑟7.2 = (100 / (𝑛𝑟7.1 + 𝑛𝑟7.2 + 𝑛𝑟7.3)) 𝑥 𝑛𝑟7.2
3. Local Government policy orientation
The formula used to calculate the composite indicator (CI) value of the Local Government policy orientation is:
𝐶𝐼7.3 = 𝑏𝑟7.3 × 𝑛𝑟7.3 × 𝑛𝑘7.3
Description:
CI7.3 = composite indicator of policy support for fisheries management
br7.3 = the weight value indicator of the policy support for management fishery nr7.3 = the value rating indicator of policy support for management fishery nk7.3 = the value criteria indicator of policy support for management fishery
From 4 (four) indicators in the stakeholder domain, the ranking value of the policy orientation indicator for the Regional Government is the lowest among the existing indicators, namely with a value of 1. Thus the weight of the indicator orientation of the Regional Government policy towards fisheries management is 14.3. It shows that the indicator of policy support for fisheries management has the smallest effect on the stakeholder domain. The formula used to calculate the value of br is:
𝑏𝑟7.3 = (100 / (𝑛𝑟1 + 𝑛𝑟2 + 𝑛𝑟3)) 𝑥 𝑛𝑟7.3
4. Local-scale fisheries management institutions
The formula used to calculate the composite indicator value (CI) of local-scale fisheries management institutions is:
𝐶𝐼7.4 = 7.4 𝑥 𝑛𝑟7.4 𝑥 𝑛𝑘7.4
Description:
CI7.4 = Composite institutional indicators for managing local scale fisheries br7.4 = value of institutional indicator weight for managing local scale fisheries
nr7.4 = ranking value of institutional indicators for managing local scale fisheries nk7.4 = value of institutional indicator criteria for managing local scale fisheries
From 4 (four) indicators in the stakeholder domain, the ranking value of institutional indicators for local scale fisheries management is the second highest among the existing indicators, namely with a value of 3. Thus the weight of institutional indicators for managing local scale fisheries on fisheries management is 42.9. It shows that the institutional indicators of local-scale fisheries management on fisheries management have the second largest influence on the stakeholder domain. The formula used to calculate the value of br is:
𝑏𝑟7.4 = (100 / (𝑛𝑟1 + 𝑛𝑟2 + 𝑛𝑟3)) 𝑥 𝑛𝑟7.4
After obtaining the CI1, CI2, and CI3 values, the status of the stakeholder domain can be calculated by adding up all the composite indicators values with the following formula:
Description:
𝐶𝐷7 = 𝐶𝐼7.1 + 𝐶𝐼7.2 + 𝐶𝐼7.3 + 𝐶𝐼7.4
CD7 = composite value of Stakeholder domain
CI7.1 = composite value indicators of the Synergy level of policies/ programs/ activities across sectors
CI7.2 = composite value indicator of stakeholder capacity
CI7.3 = composite value indicator of local government policy orientation
CI7.4 = Composite value of institutional indicators for managing local scale fisheries
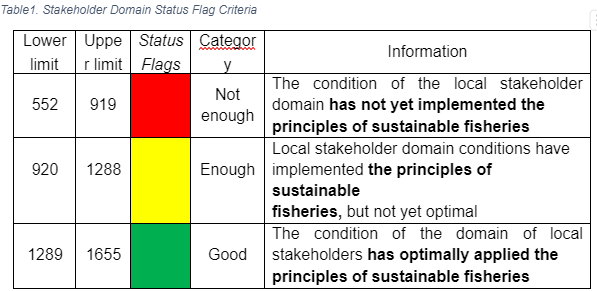
The CD7 value obtained is used to analyze the flag status condition of the stakeholder domain in the framework of implementing fisheries management with an ecosystem approach or the Ecosystem Approach to Fisheries Management (EAFM) in inland waters. The status flag criteria for stakeholder domains are grouped based on 3 (three) categories, namely:
After obtaining all CD values, the next step is to determine the status flags for fisheries management conditions in an inland waters ecosystem, namely by calculating the aggregate of all EAFM domain composite values using the following formula:
Description:
ca = aggregated value of all EAFM domains
CD1 = composite value of environmental domain of fish resources CD2 = composite value of fishing technology domain
CD3 = composite value of the social domain
CD4 = composite value of the economic domain
CD5 = composite value of managed fish species domain CD6 = composite score of governance domain
CD7 = composite value of stakeholder domain
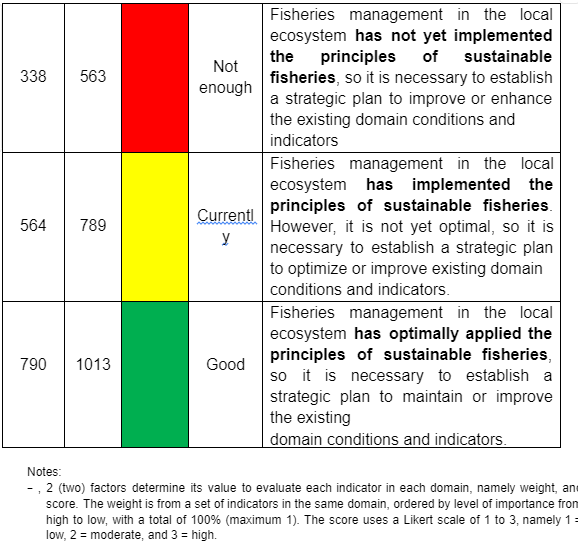
The flag status criteria for fisheries management conditions in an inland waters ecosystem are grouped into 3 (three) categories, namely:
In short, the assessment of EAFM indicators used in the process of input and analysis of stakeholder domain data can be illustrated as follows:
Notes:
− 2 (two) factors determine its value to evaluate each indicator in each domain, namely weight and score. The weight is from a set of indicators in the same domain, ordered by level of importance from high to low, with a total of 100% (maximum 1). The score uses a Likert scale of 1 to 3, namely 1 = low, 2 = moderate, and 3 = high.
Based on the calculation of the CD7 value above, it is known that the stakeholder domain status flag is yellow or in moderate condition. It shows that local stakeholder domain conditions have implemented the principles of sustainable
fisheries but are not yet optimal, so a strategic plan is needed to optimize or improve existing domain conditions and indicators.


