CHAPTER III. Assessment of EAFM Indicators in the Fish Resources Environmental Domain
3.1. Data collection technique
In evaluating EAFM indicators in the Fish Resources Environmental Domain, primary data can be obtained through direct field observations and secondary data from available references. Interviews were conducted after determining the selected respondents from the sampling results. Face-to-face debriefing was carried out using a guide or questionnaire to obtain information according to the purpose of this study. The characteristics of direct interviews are as follows.
-
The interviewer and respondent do not know each other;
-
The interviewer asked the respondent to answer the following;
-
The interviewer is neutral, does not direct the respondent; and
-
The questions asked to follow the guide or questionnaire.
Sampling was done using the stratified random sampling method, in which the interview respondents were determined in stages. This sampling technique pays attention to each population element from each group that does not overlap (homogeneous elements) and must have the same opportunity. Strata sampling can use administrative limits or the type of fishing gear used. The allocation of the number of samples from each level is sought using the principle of proportional allocation.
Data was collected to obtain information according to each indicator, so each indicator has criteria for determining its status. Because each indicator has a different data source, the assessor needs to know where and how the data source can be obtained.
In measuring environmental indicators of fish resources, the parameters measured are fluctuations in water level, pollution, borders, reserve areas, environmental modifications, siltation or reduction of water area and important habitats, with data collection techniques for each indicator described as follows:
-
Water Level Fluctuations
Data/information on water level fluctuation indicators can be obtained through the following:
-
Direct observation data to the field related to the phenomenon of waterlogging;
-
Water level data for the last 5 (five) years from the local work unit in charge of water resources;
-
Rainfall data for the last 5 (five) years from the local work unit in charge of meteorology, climatology, and geophysics;
-
Wetland image data within the last 5 (five) years from the work unit in charge of geospatial or space information;
-
Research results or monitoring data from related work units/stakeholders; and/or
-
Results of interviews with other fishermen/respondents who have visual experience in the last 5-10 years
The steps for giving a criterion value to the Community Participation indicator are as follows:
-
Collect the data of all water level fluctuation events in an inland water ecosystem.
-
Giving the criterion value (nk) of the water level fluctuation indicator with the following criteria values:
-
nk 1 = fluctuations in water levels during high and low water seasons have decreased in the last 5-10 years;
-
nk 2 = fluctuations in water level during high and low water seasons in the last 5-10 years;
-
nk 3 = Fluctuations in water levels during high and low water seasons have increased in the last 5-10 years.
Some of the stakeholders who can be used as respondents in evaluating indicators of water level fluctuations include:
-
Work unit in the field of water resources;
-
Work unit in the field of climatology;
-
Academics/researchers from higher education institutions/other research institutions;
-
Fisheries instructor
-
Fisherman.
-
Pollution
Pollution indicator data/information can be obtained through:
-
Results of direct field observations related to biological contamination parameters (water plant cover, bacteria/plankton/algae) which were carried out in a representative manner, both in terms of time and distribution of observation locations;
-
The latest data related to biological pollution from work units in charge of water resources or the environment;
-
Scientific data from related research institutions or academics and/or
-
Results of interviews with fishermen/other competent respondents.
The steps for assigning a criterion value to the pollution indicator are:
-
Collect the data on all pollution events in an inland water ecosystem.
-
Giving value criteria (nk) indicators of pollution, with the following value criteria:
-
nk 1 = heavily polluted waters or smell and dark color or cause mass death of fish
-
nk 2 = moderately polluted waters or unfit for drinking but still suitable for bathing; And
-
nk 3 = lightly polluted waters or still fit for drinking.
Several stakeholders who can be used as respondents in assessing pollution indicators include:
-
Work unit in the field of the environment;
-
Academics/researchers from higher education institutions/other research institutions;
-
Fisherman;
-
fishery extension;
-
Riparian vegetation
Indicator data/information on riparian vegetation can be obtained through the following:
-
The results of direct field observations related to the average width of the demarcation and the variation of the vegetation which was carried out on a representative basis;
-
The latest data related to demarcation from work units in charge of water resources or the environment;
-
Research data from related research institutions or academics. And/or
-
Results of interviews with fishermen/other competent respondents.
The steps for giving criterion values to indicators of riparian vegetation that is:
-
Collect the data on all border widths and/or littoral areas in an inland waters ecosystem;
-
Give the criterion value (nk) of border indicators and/or littoral areas with the following criteria values:
-
nk 1 = no demarcation (function switch);
-
nk 2 = demarcation 1-15 m;
-
nk 3 = demarcation >15 m
Some of the stakeholders who can be used as respondents in assessing riparian vegetation indicators include:
-
Work units in the field of public works;
-
Work units in the field of environment and forestry;
-
Academics/researchers from institutions of higher education/other research institutions
-
Fisheries Restricted Areas
Data/information on indicators of fisheries-restricted areas can be obtained through the following:
-
Results of identification of the distribution and existence of fisheries restricted areas;
-
Information on the management of fisheries restricted areas from the work unit in charge of fisheries;
-
Research data from related research institutions or academics; and/or
-
Results of interviews with fishermen/other competent respondents
The steps for assigning a criterion value to the indicators of fisheries-restricted areas are:
-
Collect the data on all activities in the management of the fisheries-restricted regions in an inland waters ecosystem
-
Giving the criterion value (nk) of the indicator of the fisheries restricted areas, with the following value criteria:
-
nk 1 = no fisheries restricted areas;
-
nk 2 = there is a no fisheries restricted areas, but not yet managed/maintained;
-
nk 3 = there is a fisheries restricted areas managed/guarded by local stakeholders
Several stakeholders who can be used as respondents in assessing indicators of fisheries-restricted areas include:
-
Work units in the fisheries sector;
-
Work units in the field of forestry and the environment;
-
Public figure;
-
Fishery extension;
-
Fisherman;
-
Environment Modification
Environmental modification indicator data/information can be obtained through:
-
Direct observation data to the field related to modification of the inland water environment;
-
Data on utilization/ exploitation of water resources in waters from work units in charge of public works/water resources/spatial planning;
-
Research data from related research institutions or academics and/or
-
Results of interviews with fishermen/other competent respondents.
The steps for assigning criteria values to environmental modification indicators are as follows:
-
Collect the data on all environmental modification activities in an inland water ecosystem.
-
Give the value of the criteria (nk) environmental modification indicators with the following value criteria:
-
nk 1 = there is a modification of the environment, which disrupts the life cycle of fish;
-
nk 2 = there is an environmental modification, but it has not disrupted the fish life cycle;
-
nk 3 = no environmental modifications
Some of the stakeholders who can be used as respondents in evaluating environmental modification indicators include:
-
Work units in the field of forestry and the environment;
-
Work units in the field of public works;
-
Public figure;
-
Fishery extension;
-
Fisherman.
-
Siltation
Data/information on siltation indicators can be obtained through:
-
Direct observation data to the field related to the phenomenon of siltation of inland waters;
-
Data on changes in depth and area of waters in the last 5 (five) years from local work units in charge of public works/spatial planning/water resources/environment;
-
Wetland image data within the last 5 (five) years from the work unit in charge of geospatial or space information;
-
Data from research results or monitoring of related parties; and/or
-
Results of interviews with fishermen/other respondents who have a visual experience
The steps for assigning a criterion value to the siltation indicator are:
-
Collect the data on all events of siltation or reduction of water area in an inland water ecosystem.
-
Give the criterion value (nk) of the silting waters indicator with the following criteria values:
-
nk 1 = siltation occurs > 20%
-
nk 2 = siltation occurs <20%
-
nk 3 = siltation has not occurred
Some of the stakeholders who can be used as respondents in assessing indicators of siltation include:
-
Work units in the field of forestry and the environment;
-
Work unit in the field of water resources;
-
Work unit in the geospatial/space sector;
-
Public figure;
-
Fishery extension;
-
Fisherman;
-
Important Habitats
Important habitat indicator data/information can be obtained through the following:
-
Direct observation data to the field regarding the existence and condition of important habitats in an inland waters ecosystem;
-
Monitoring data of the work unit in charge of fisheries;
-
Scientific data from related research institutions or academics; and/or
-
Results of interviews with fishermen/other competent respondents
The steps for assigning criteria values to important habitat indicators are:
-
Collect the data on all important habitat locations in an inland water ecosystem.
-
Give the criterion value (nk) of important habitat indicators with the following value criteria:
-
nk 1 = condition of important habitat has changed/decreased and not recoverable
-
nk 2 = important habitat conditions have changed/decreased but are still recoverable
-
nk 3 = important habitat condition has not changed/decreased
Several stakeholders that can be used as respondents in assessing important habitat indicators include:
-
Work units in the fisheries sector;
-
Academics/researchers from higher education institutions/other research institutions;
-
Public figure
-
Fishery extension;
-
Fisherman;
3.2. Analysis Techniques
EAFM analysis is a multi-attribute approach to symptoms or performance indications of aquatic ecosystem conditions. Substantially, the assessment of EAFM indicators is a multi-criteria analysis system that ends in assessing a composite index to determine the status of fisheries management using the Flag Modeling technique (Adrianto, Matsuda, and Sakuma, 2005). Data analysis is needed to find out the relationship between the current management performance status based on the data of each indicator in the stakeholder domain and recommendations for fisheries management actions that will be developed.
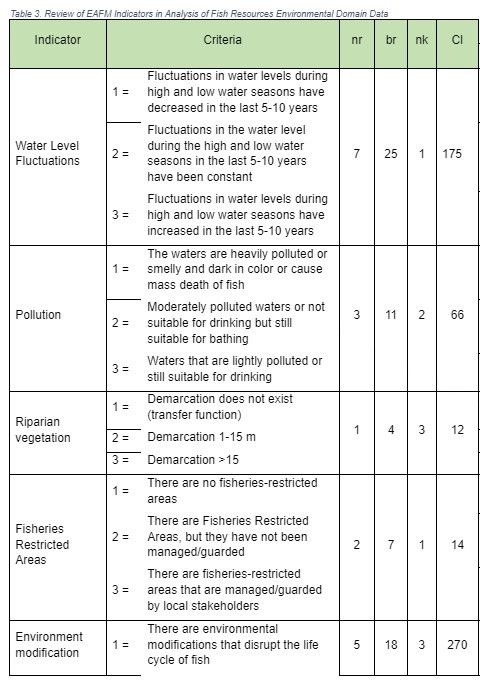
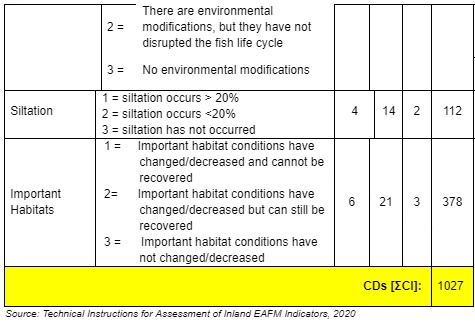
Currently, there are tools available that can be used to analyze the condition of EAFM and the conditions of each EAFM domain, especially the stakeholder domain, namely by using the EAFM indicator assessment matrix (as attached). In detail, the method for calculating the composite score on social indicators and domains is described as follows:
-
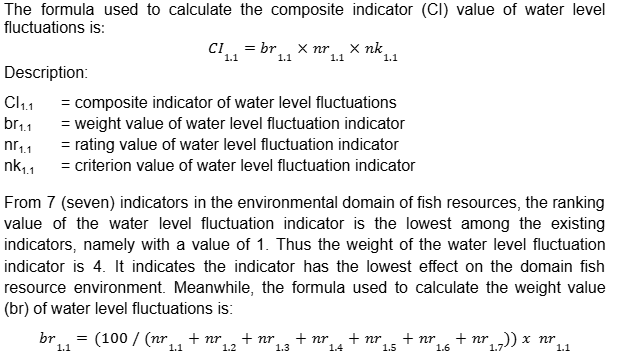
Water level fluctuation
-
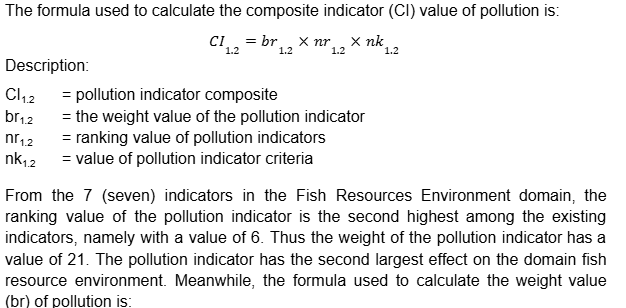
Pollution
-
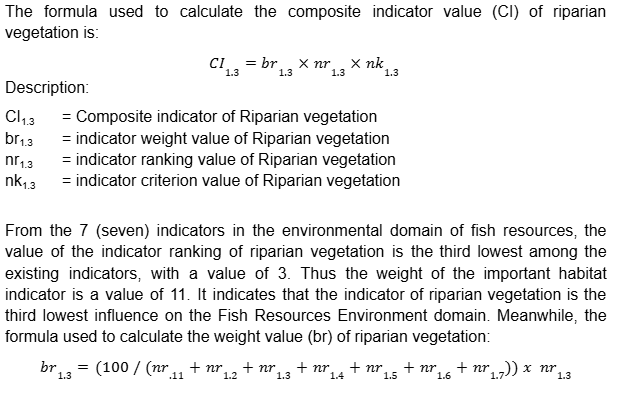
Riparian vegetation
-
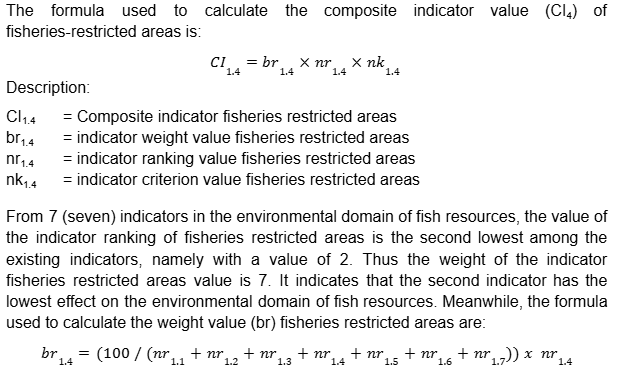
Fisheries Restricted Areas
-
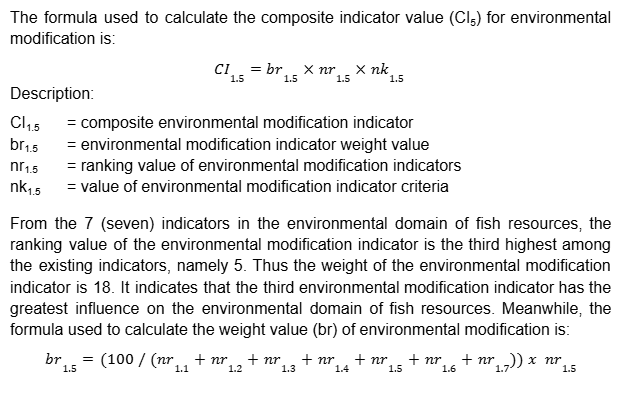
Environment modification
-
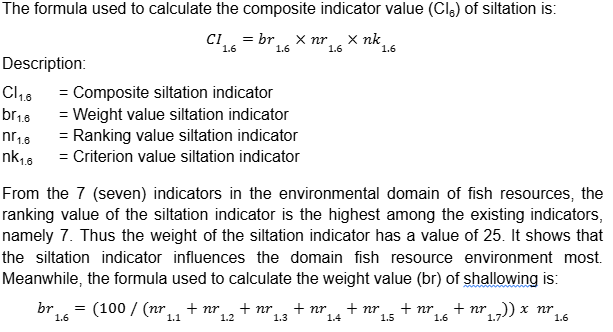
Siltation
-
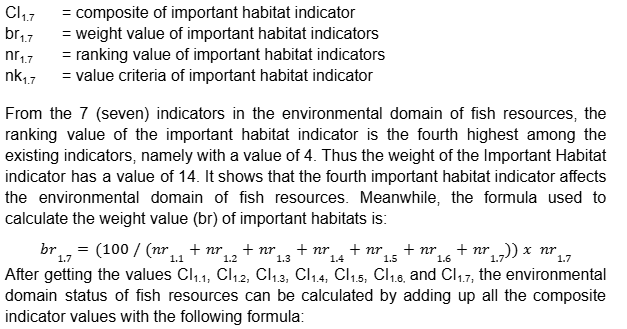
Important Habitats
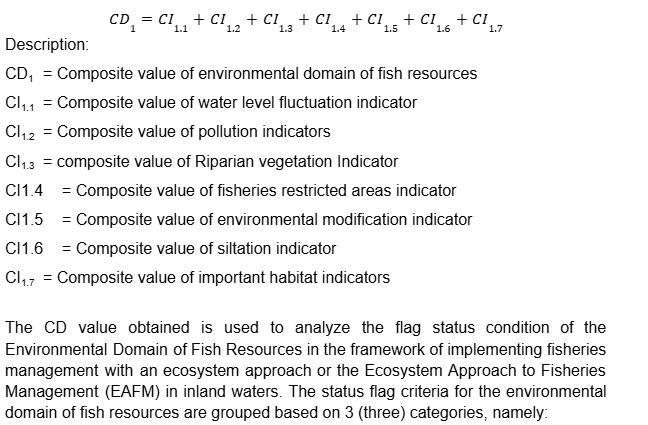
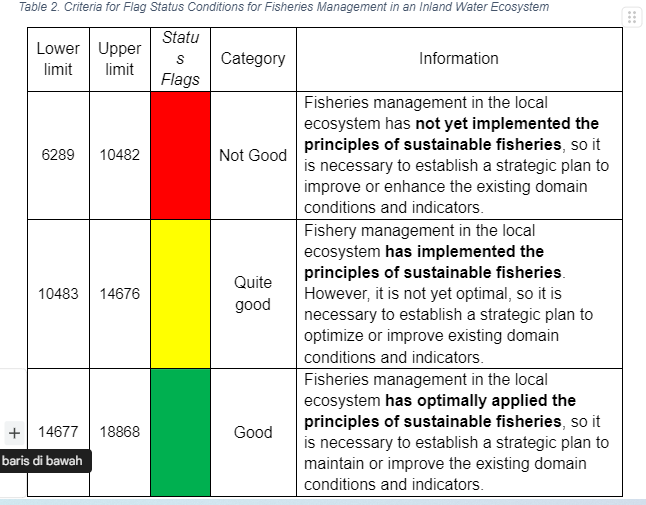
After obtaining all CD values, the next step is to determine the status flags for fisheries management conditions in an inland waters ecosystem, namely by calculating the aggregate of all EAFM Domain Composite values using the following formula:
In short, the assessment of EAFM indicators used in the input process and analysis of Social Domain data can be illustrated as follows:
Notes:
2 (two) factors determine its value to evaluate each indicator in each domain, namely weight and score. The weight is from a set of indicators in the same domain, sorted by importance from high to low, with a total of 100% (maximum 1). The score uses a Likert scale of 1 to 3, namely 1 = low, 2 = moderate, and 3 = high.
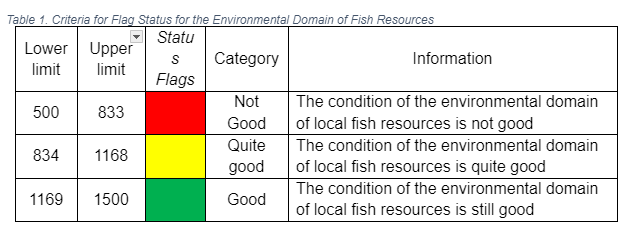
Based on the calculation of the CD1 value above, it is known that the Fish Resources Environmental Domain status flag is yellow or in moderate condition. It indicates that the condition of the local Fish Resources Environmental Domain has implemented the principles of sustainable fisheries but is not yet optimal, so it is necessary to establish a strategic plan to optimize or improve the existing conditions of the domain and indicators.

